The first set of sensors installed by LJMU on the Sustainable Green Travel Corridors project were in Halton, in December 2019. These motion, weather and air quality sensors are situated in Appleton Village Road, within close vicinity of shops, schools and Victoria Park.
What can we learn about Halton from the data over 12 months?
Between 1st January 2020 and 1st January 2021:-
- The average number of monthly pedestrian journeys per was 10,553
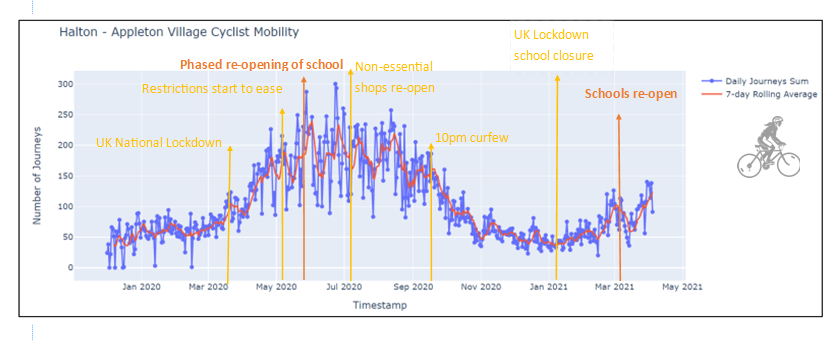
- The average number of monthly cycling journeys was 1,375.
- May was the busiest month for cycling journeys when 5,672 were recorded.
- Tuesday 23rd June 2020 was the busiest day for cyclists in Halton having recorded 300 cycling journeys with a surge of journeys recorded between 3-4 pm, enjoying a temperature of 26.4C
- Our data shows that more cars travel in the direction towards Victoria Park than away from the park.
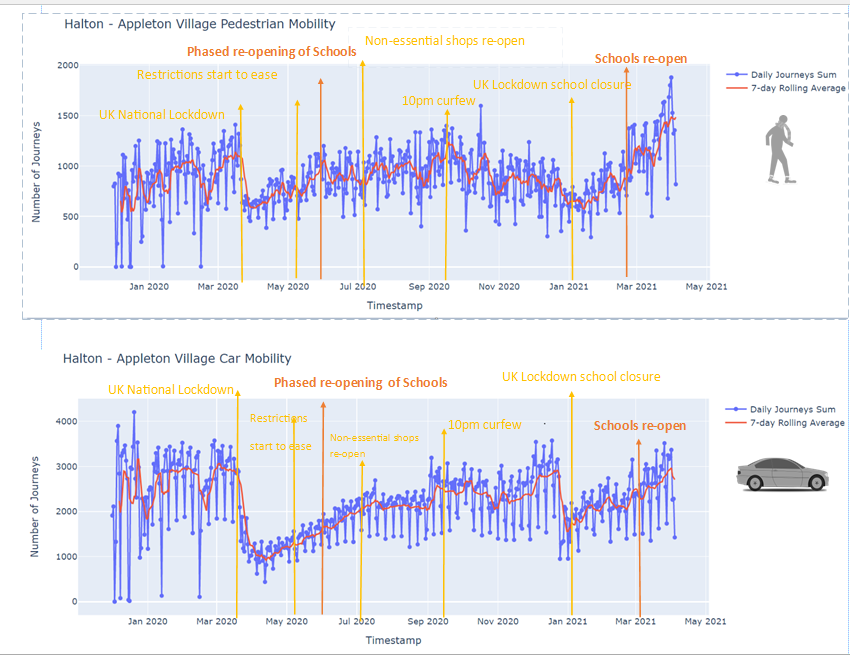
When government restrictions were enforced in the UK (Covid 19)
1. After the start of UK national lockdown (w/c 23rd March 2020):
a). Cycling journeys significantly increased.
b). Pedestrian journeys significantly decreased. We believe this is due to school closure.
c). Car journeys significantly decreased.
2. In the week after early May bank holiday (3rd May 2020), cycling and pedestrian journeys significantly dropped. This is likely to be due to the holiday itself and heavy rain during that week.
3. After Covid-19 restrictions started to ease (w/c 31st May 2020), car journeys increased gradually.
4. After schools re-opened (w/c 30th August 2020), car and pedestrian journeys significantly increased. This likely links to the close proximity of the sensor to three schools.
5. When the 10pm curfew started and temperature/weather conditions started to deteriorate and the impact was?.
From the graphs below, we can see the impact of key government decisions during this time.